What is Graph mapper
The Graph Mapper in Grasshopper is a powerful component that lets you reshape and control numerical data using curve-based functions. Instead of working with complex math manually, you can visually manipulate values through an interactive graph interface. This makes it an essential tool for designers who want precise control over gradient Flow of spacing, and smooth transitions in their parametric models.
How to Use Graph Mapper in Grasshopper
To begin using the Graph Mapper, you first need to choose the type of curve that will control the value distribution.
Right-click on the Graph Mapper component, navigate to Graph Types, and select one of the available curve options. Each option includes a small preview, showing how values will be remapped.
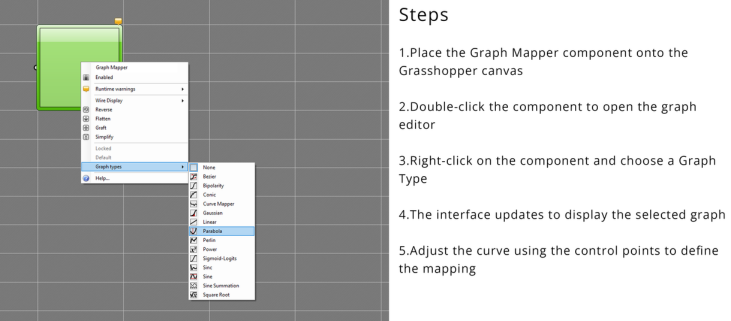
Among these, the Bezier graph is the most commonly used, as it offers the highest level of control over the curve shape. It allows you to precisely define how values are redistributed.
Once a graph type is selected, the interface updates to display the chosen curve. You can then adjust its shape using the control points (white handles). By moving these handles, you directly influence how input values are transformed into output values.
What Does the Graph Mapper Do?
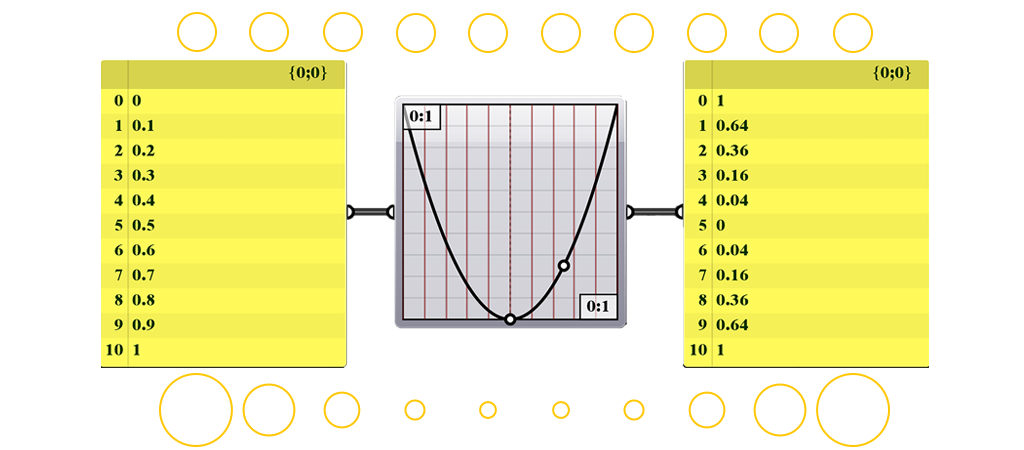
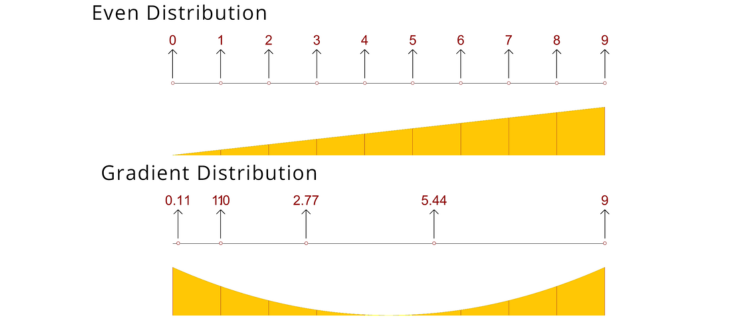
In simple terms, the Graph Mapper transforms a set of evenly spaced numbers into a customized distribution.
For example, if you start with values from 0 to 10 spaced evenly, the Graph Mapper allows you to redistribute those values into a gradient—making some values closer together and others further apart.
How Graph mapper works
How It Works
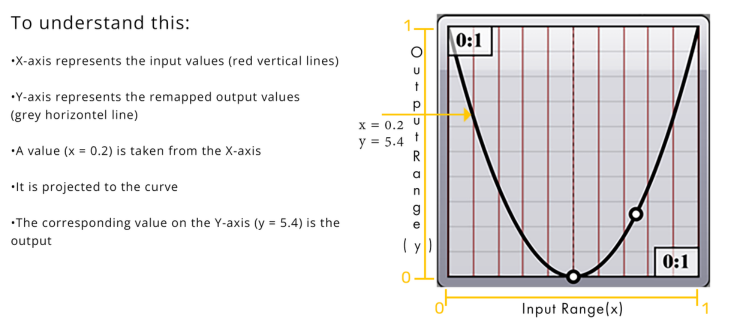
- Input values are plotted along the X-axis
- Output values are generated along the Y-axis
- A curve defines how values are remapped
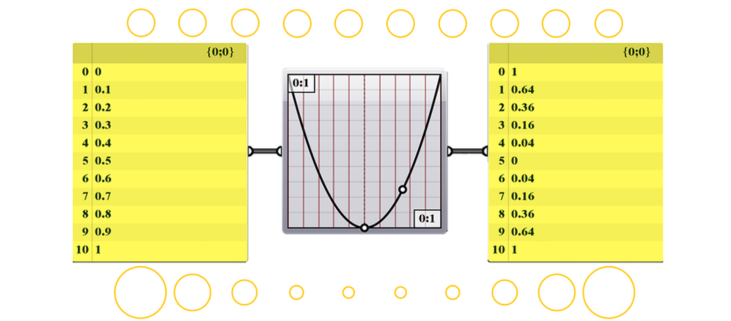
This process is applied to all values, creating a smooth gradient transformation. Why Designers Use Graph Mapper
Understanding the Image Domains
The Graph Mapper is widely used in parametric design because it allows:
- Smooth geometric transitions
- Controlled spacing of elements
- Interactive design adjustments
- Visual control without complex equations
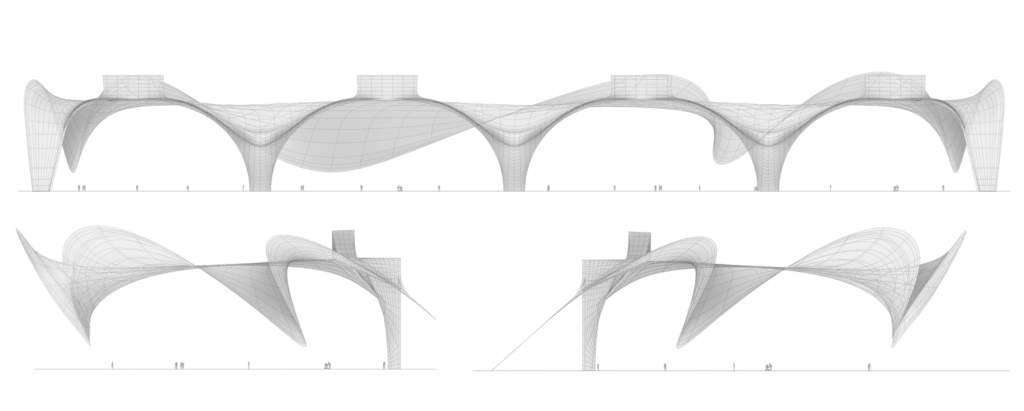
In many modern architectural workflows, it plays a key role in creating fluid and adaptive designs.
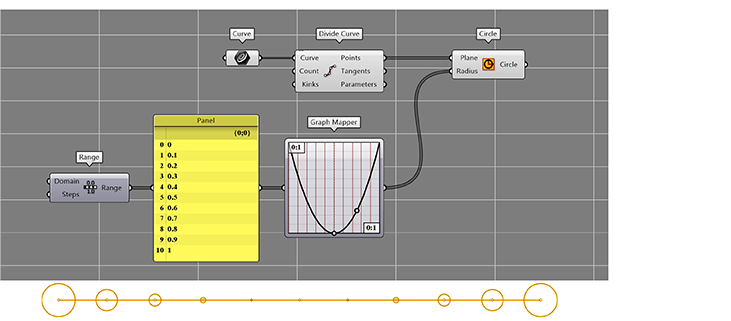
Graph Simple Example script
- Generate values between 0 and 1 using a Range component
- Feed those values into the Graph Mapper
- Connect the output to Circle
- Adjust the curve handles to control point distribution
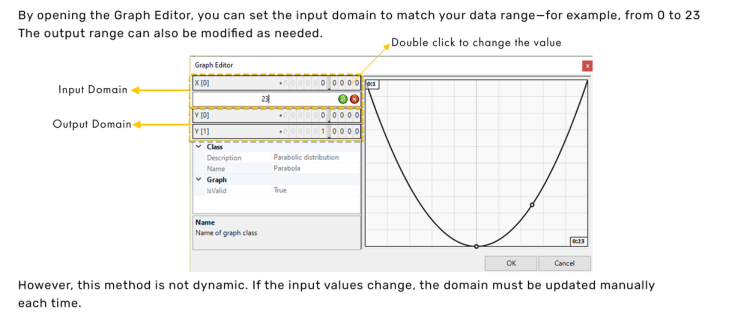
Handling Input Values Outside the 0–1 Range
The Graph Mapper works with a default input domain of 0 to 1, but in most cases, the values we work with fall outside this range. For example, a set of values might range from 3.52 to 44.29.
If these values are directly connected to the Graph Mapper without adjustment, they won’t be distributed correctly, since the component expects inputs within the 0–1 domain.
Adjust Graph Domain Manually
The input and output ranges of the Graph Mapper can be manually edited
Final Thoughts
The Graph Mapper is one of the most versatile tools in Grasshopper. It bridges the gap between mathematics and design by giving you
intuitive control over complex value transformations.
If you want to create responsive, smooth, and visually refined parametric designs, mastering this component is non-negotiable.
Start experimenting with it—you’ll quickly see how powerful it is.
Conclusion
The Graph Mapper in Grasshopper is a simple yet powerful tool for controlling data and creating smooth gradients in parametric design. By visually remapping values, it allows designers to achieve precise control over spacing, form, and transitions without relying on complex mathematics. Whether you are working on architectural elements, patterns, or generative systems, mastering this component can significantly improve your workflow. With consistent practice and experimentation, you’ll be able to use Graph Mapper more effectively to create refined, dynamic, and responsive designs that enhance both functionality and visual quality.
Real world example

Recent Project